With just two weeks until Election Day, we present to you our “bottom line” on the various US election scenarios, the policy implications, and the likely impact these will have on the economy and a wide range of asset classes and sectors. We highlight the consequences of the US election on the economy and financial markets, while also examining the vast array of other important factors that are likely to influence the outlook, such as global central bank rate cuts, fiscal stimulus from China, geopolitical developments, and others.
This year’s often dramatic twists and turns in the campaign, as well as the contrast in policy proposals from the two candidates, add weight to the event on 5 November. Yet we have stressed one very important point all along: do not mix politics with your portfolio. This advice has so far proven to be sound despite the palpable angst over the election result: a global 60/40 stockbond portfolio has returned an impressive 11% year to date. And while we do not recommend large shifts in your strategic asset allocation related to possible election outcomes, we still advocate tactical opportunities to either enhance your investment performance or minimize volatility.
We present our best tactical investment views, with a special focus on the relevant election themes and how the election outcome could influence performance. It has been our pleasure to cover the 2024 US election for you, and we hope we have earned your trust as an objective and nonpartisan source for relevant economic and investment advice.
State of the race
Election outlook
Presidential and congressional elections are under way across America, with citizens in more than half of the states now voting either by mail or casting their ballots in person before Election Day. The race for the White House remains exceptionally close, with candidate preference polls giving Vice President Harris a slight edge in some battleground states and former President Trump narrowly leading in others. While it may be tempting to attribute the tightness of this year’s contest to the polarized political climate, it is worth remembering that presidential races are often decided at the margin. Since 1960, six different elections have been decided by fewer than 150,000 votes in just a few states.
Polling errors in presidential elections have undermined public confidence in the accuracy of election forecasts, but there were fewer such errors in the past two midterm elections. The presence of Donald Trump on the ballot in 2016 and 2020 may be one reason for the disparity in performance. Preference polls in the past have underestimated the former president’s ability to generate support from individuals who usually do not vote in other elections. Trump appears to have recognized his reliance on low propensity voters, which helps to explain his focus on rallying his base at the expense of broadening his coalition.
Harris has pursued a contrary strategy. She has focused on college-educated women, African American voters, and younger individuals not affiliated with either political party. Trump’s base of support is fixed, whereas support for Harris appears more fluid. The Harris campaign has responded by focusing on local organizing efforts to turn out voters; her campaign has deployed 2,500 campaign staffers in 350 offices, most of whom are in battleground states.
Prior to his withdrawal from the race in July, President Biden’s path to victory was exceedingly narrow and depended upon winning Wisconsin, Michigan, and Pennsylvania. Harris is a more competitive candidate in sunbelt states than was Biden and has more alternative paths to secure the requisite 270 electoral votes. However, both Harris and Trump are eyeing Pennsylvania and its 19 electoral votes as the most direct route to victory in November. Harris has 50 campaign offices in the state, while Trump has more than two dozen, and both candidates are expected to barnstorm there in the final two weeks of the campaign.
Donald Trump’s commanding lead in voter preference polls dissipated in late summer in the wake of Joe Biden’s unexpected withdrawal from the race. Kamala Harris’ early momentum closed the gap that had opened between the Republican and Democratic candidates earlier this year but her level of support among likely voters has plateaued. Trump and Harris are now in a dead heat, with neither candidate holding a definitive advantage as we enter the home stretch of this election cycle. We have adjusted our probabilities accordingly (see Figure 1).
The US economy, a top issue for voters in most elections, is in decent shape, and equity markets have responded positively to the Fed’s forward guidance and less restrictive monetary policy. However, even though mortgage rates have declined, affordable housing remains a challenge in many parts of the nation and higher prices for everyday items continue to grate on consumers. The rate of inflation has declined, but it normally takes some time for the disinflationary impacts to be fully appreciated by voters. Public anxiety over illegal immigration poses the biggest challenge for Harris, while Trump faces criticism over restrictions on reproductive rights. Both candidates face entrenched opposition with fewer uncommitted voters to be swayed. The outcome is almost entirely dependent on voter turnout.
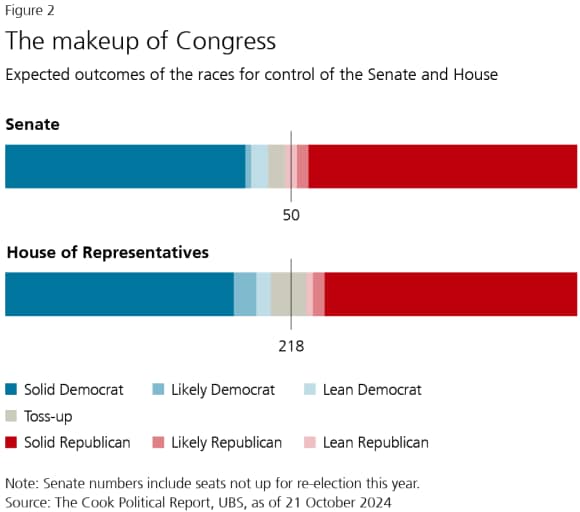
Democrats were always expected to face an uphill battle to retain control of the Senate considering the unfavorable map in this election cycle. The open West Virginia seat appears to be a lock for Republicans, and Democrat Jon Tester in Montana faces an uphill battle to surmount a sizable polling deficit. The Senate races in Ohio and Wisconsin have become more competitive as incumbent Democrats face difficult races. We have increased the probability that control of the Senate will shift to the GOP.
Control of the House of Representatives is less certain, but Democrats are well-positioned in this cycle simply because there are more seats held by Republicans in districts won by Biden than seats held by Democrats in districts won by Trump. Republicans often gain seats in one chamber of Congress while Democrats gain seats in the other, but it would be unprecedented in American history for those gains to result in a simultaneous change of control in opposite directions. And yet, in this cycle, we believe that is a better-than-even outcome. We assign a 65% likelihood that Democrats will assume narrow control of the House.
Battleground states
Elections for federal offices are managed by state governments, which apply idiosyncratic rules to tally votes. For example, 12 states allow election officials to begin counting absentee and mailed ballots before Election Day. Fourteen others prohibit such ballots from being counted until after the polls close. For those interested in monitoring the results on election night, we believe certain bellwether counties in each of the seven battleground states offer a preview of the statewide results.
Timeline of election and fiscal events
The nation is remarkably divided, with the presidential race between former President Trump and Vice President Harris basically a toss-up. Although national presidential poll averages have shown Harris with a slight lead, Electoral College probabilities and prediction markets have shifted, with neither candidate holding a commanding advantage in the seven battleground states. Moreover, House and Senate majorities are likely to be exceedingly narrow no matter which party wins.
These circumstances are hardly new. In the 2016 presidential election, Hillary Clinton lost by 70k votes in three states despite winning the popular vote by two points. In 2020, the election was decided by 44k votes in three states, even though President Biden won the popular vote by four points. In the contested 2000 election between Texas Governor George W. Bush and Vice President Al Gore, the margin of victory in the tipping point state of Florida was a mere 537 votes.
A divided electorate raises the odds of not knowing the outcome on election night and of an eventual contested election. Systemic polling error or unusually high turnout could produce lopsided results and an Electoral College landslide. But if the polls are accurate, we could be waiting days or even weeks for a winner to be declared. Hand counting of mail-in ballots, requests for recounts, and lawsuits by both parties could all extend the time it takes to declare a winner.
Below, we list important electoral college and fiscal dates to keep in mind after Election Day.
Key election and fiscal dates
2024
5 November: Election Day
11 December: Certify electors
17 December: State vote of electors
20 December: Deadline to fund government
25 December: Electoral votes received in DC
2025
2 January: Debt ceiling suspension ends
3 January: 119th Congress convenes
6 January: Congress counts electoral votes
20 January: Inauguration Day
Our macro and financial market views
Portfolio strategy*
As the 2024 election approaches, it is essential to anticipate potential tax changes that could affect your financial plan. Understanding these changes and taking steps ahead of time can help you improve your after-tax wealth potential. Below, we explore the actions that you can implement to manage three of the possible tax increases.
1. Higher capital gains taxes
The top marginal tax rate on dividends and long-term capital gains is currently 23.8% (20% marginal income tax plus 3.8% net investment income tax (NIIT)). Vice President Kamala Harris has proposed increasing this top rate to 33% (28% top marginal tax rate plus a 5% NIIT).
- Likelihood: A capital gains tax increase could occur in a Blue sweep, which we estimate at a 5% probability.
- Action: If you already plan to realize gains soon, you may want to do so at the current lower rates. Otherwise, deferring capital gains is usually a prudent strategy, even if tax rates rise. For more details, see Should you harvest capital gains at today’s rate?
2. Increased income taxes
The 2017 Tax Cuts and Jobs Act’s personal income tax provisions are set to expire at the end of 2025, leading to a rise in the top marginal tax rate from 37.0% to 39.6%, a halving of the standard deduction, and a reversion of tax brackets to 2017 levels, adjusted for inflation.
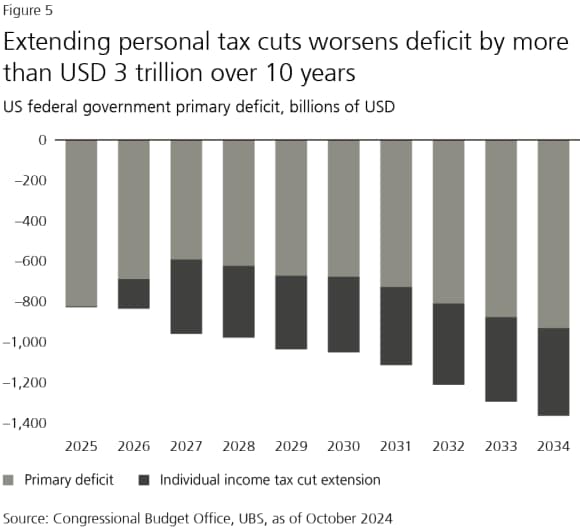
- Likelihood: Taxes will rise automatically if Congress does not act. Given the USD 3 trillion price tag over 10 years for an extension and the potential for congressional gridlock, we see a risk that at least some tax increases will go through.
- Actions: (1) If retired or expecting a higher tax bracket when required minimum distributions begin, consider partial Roth conversions in 2024 and 2025. (2) Exercise nonqualified stock options and incentive stock options in 2024 and 2025 to take advantage of lower tax brackets, and the temporarily higher Alternative Minimum Tax income exemption. (3) Consider postponing some itemized deductions until 2026.
3. Estate tax changes
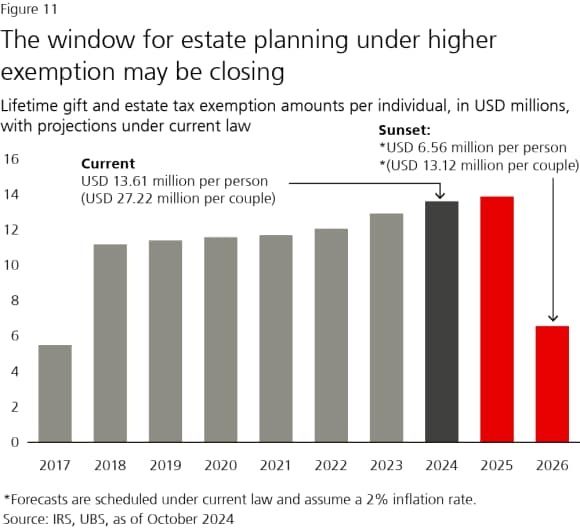
The current law allows individuals to give away USD 13.61 million (USD 27.22 million for married couples) without incurring gift or estate taxes (which have a top tax rate of 40%). Without congressional action, this exemption will decrease to USD 6.56 million per individual after 2025 (see Figure 11).
- Likelihood: This reduction will happen automatically if Congress does not intervene. There appears to be little interest in raising taxes elsewhere to fund an extension.
- Actions: Urgently work to establish a trust and estate plan, discussing your priorities with your family, and working with experts to implement your plans. Finding a qualified estate attorney may become challenging as the deadline approaches.
Conclusion
Ask your financial advisor and your tax advisor about how you can personalize your strategy to improve your after-tax growth potential. To learn more, read our other reports, How to prepare for (potentially) higher taxes and Year-end priorities and a preview of 2025.
Global asset class preferences definitions
Global asset class preferences definitions
The asset class preferences provide high-level guidance to make investment decisions. The preferences reflect the collective judgement of the members of the House View meeting, primarily based on assessments of expected total returns on liquid, commonly known stock indexes, House View scenarios, and analyst convictions over the next 12 months. Note that the tactical asset allocation (TAA) positioning of our different investment strategies may differ from these views due to factors including portfolio construction, concentration, and borrowing constraints.
Most attractive: We consider this asset class to be among the most attractive. Investors should seek opportunities to add exposure.
Attractive: We consider this asset class to be attractive. Consider opportunities in this asset class.
Neutral: We do not expect outsized returns or losses. Hold longer-term exposure.
Unattractive: We consider this asset class to be unattractive. Consider alternative opportunities.
Least attractive: We consider this asset class to be among the least attractive. Seek more favorable alternative opportunities.


