Capital Market Assumptions 2020 to 2025
Part I: Deterministic scenario projections
We present four sets of projections of the economy and capital markets.

We present four sets of projections of the economy and capital markets.
Bull Case
Bull Case
- The global economy and capital markets quickly return to the pre-pandemic world of moderate growth and low inflation, potentially as a result of a successful vaccine. The economy and markets re-adapt quickly. Few permanent disruptions occur, as airlines, hotels and other vulnerable industries survive much in their current form.
Base Case
Base Case
- Growth returns in the latter half of 2020 and gradually trends back toward normal growth. Some de-globalization, lingering outbreaks of COVID-19 and precautionary behaviors by consumers and businesses hamper growth initially. Inflation starts low and rises back toward trend.
Stagnation
Stagnation
- This is a combination of sluggish growth and low inflation
- Japanification. The economy rolls out of the pandemic- induced recession with a burst of growth, but this quickly subsides and continues at a low level.
Stagflation
Stagflation
- We model this as a combination of a sharp recession followed by low growth and rising inflation. Supply-side constraints limit growth and ultimately trigger inflationary pressures. Eventually, bond vigilantism reappears as investors become nervous about inflation and higher interest rates. Central banks struggle with the direction of monetary policy: higher interest rates to fight inflation or lower interest rates to spur the economy.
While our research encompasses a large range of asset classes around the world, for simplicity we present scenarios focusing on the United States as the representative economy. The projections here can be extended to many regions without loss of direction and magnitude.
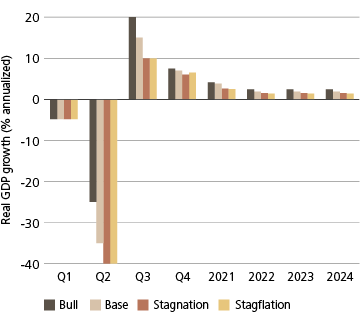
The following graphs show the paths of growth across the four scenarios. (These should broadly represent most of the developed world and many emerging markets.)
Real GDP growth across scenarios
Real GDP growth across scenarios
Real GDP across scenarios
Real GDP across scenarios
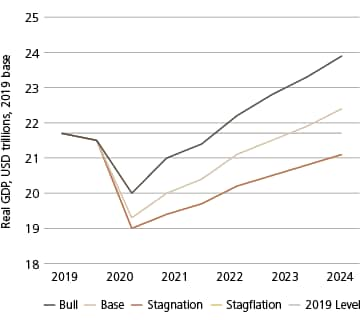
Real GDP in the US peaked in the fourth quarter of 2019 at $21.7 trillion and contracted sharply thereafter. In our base case, we project real GDP will remain below $21.7 trillion until late 2022. In the Bull case, we expect that it will be early 2021, but in both our Stagnation and Stagflation cases, which have near identical levels of growth, it will take years to recover.
In all the scenarios, we expect the normal measures of inflation to decline sharply in the coming months. In the Bull case, it rebounds to a 2.0% level and the Fed starts to raise rates in 2023. In the base case, inflation is slightly below most Central Banks' target levels (2.0%, usually). In the Stagnation case, it is initially low and stays low. In the Stagflation scenarios, inflation starts low, but aggressive monetary and fiscal stimulus triggers higher inflation, which creeps up and disrupts the markets.1
Now, let's extend these economic fundamentals to pricing in the capital markets for the four scenarios. First, below is a set of paths for the fixed income market.
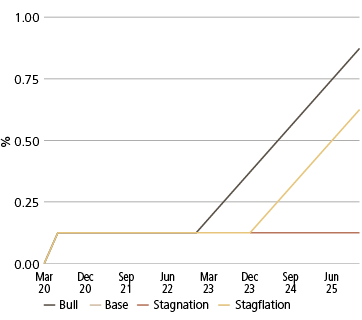
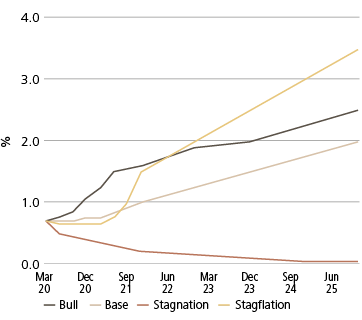
In most scenarios, we expect the Federal Reserve to keep short interest rates low and on hold well into 2022, with the most likely hikes not occurring until at earliest 2023. And we don't expect the 10-year bond yield to get near its highs seen in 2018 (less than two years ago it was over 3.0%!). The Fed has several reasons to keep rates low: a historic recession with unprecedented levels of slack in the labor market and huge budget deficits that need to be financed. In recent communications, the Fed has indicated that they are willing to have inflation above their target level of 2% for a period of time in order to achieve full employment. We expect they will apply this in the coming future.
One difficulty in modeling the Stagflation scenario is the reaction of the Fed. We have the Fed being somewhat cautious here and focusing more on employment than inflation; thus, we model T-Bills rising modestly and lagging inflation. However, a more aggressive, hawkish Fed is clearly possible over time.
A key question is how the Fed will react: does it suppress the yield curve to support weak growth or does it raise rates to trim inflation expectations starting to accelerate?
In our base case, we expect 10-year government bond yields are steady through the next few months and then gradually rise as the economy shows moderate to strong growth. In our Stagnation case, we expect rates to stay low through the projection period.
After rising sharply earlier this year, credit spreads narrowed in March and April, especially in the US where the Fed established programs to buy a wide array of bonds to keep interest rates low, facilitate easier refinancing, and provide liquidity to stressed markets. In our base Case we expect the recovery to be slower than what the market currently is pricing and we expect ongoing volatility in the credit market as the economy confronts challenges with restarting.
Projected US 1-month T-Bill yields by scenario
Projected US 1-month T-Bill yields by scenario
Projected US 10-yr yields by scenario
Projected US 10-yr yields by scenario
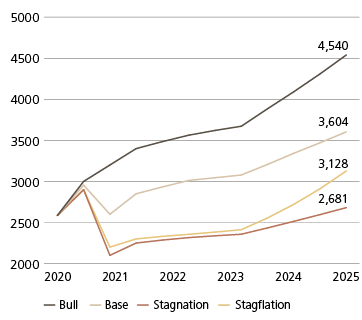
In the equity market, we lay out the potential paths for the S&P 500 price level. Our base case projection has a renewed growth in equities after a near-term drop due to on-going stumbles as the economy recovers. We don't doubt that there is a long period of growth ahead of us; we just expect it to be bumpier than indicated by the recent rally. In the Bull case, we quickly reach new highs due to economic strength resulting from fiscal and monetary stimulus. In the two bearish cases, we don't reach the February highs for many years.
On a cumulative return basis over the five years ending June 2025, we project the following sets of returns in nominal and real terms.
Projected S&P 500 price levels across scenarios
Projected S&P 500 price levels across scenarios
Five-yr nominal returns through June 2025
Five-yr nominal returns through June 2025

Five-yr real returns through June 2025
Five-yr real returns through June 2025

Some observations:
- Despite the low starting yields, the possible return upside for Treasuries in the short run is the Stagnation case. The first year of this scenario has Treasuries earning a positive return and looks even better in real terms.
- Notice that TIPS perform best in the Stagflation scenario. Initially, the returns are poor as the economy bounces back and experiences a modest rebound. It really takes off in the 'out years' as inflation builds to levels higher than anticipated.
- High yield bonds look good in all the scenarios because of the high starting yield. Spreads continued to tighten into May, so the expected returns have declined.
Stock-bond correlation
Stock-bond correlation
One key area that we want to highlight across these scenarios is the stock-bond correlation. Over the last 22 years, the returns of stocks have been negatively correlated with the return on Treasury bonds. (In general, this is true for most developed countries, but there are exceptions such as Canada, Australia and several emerging market countries).
We believe that there is an increased likelihood that this negative correlation will break down sometime in the next five years. First, with central banks committed to low interest rates, QE, and potentially yield curve control, the correlation would go to zero because short-term rates would remain constant. Then, if inflation creeps up, investors will likely start to shun bonds, pushing yields up through the auctions (though central banks will not allow significant increases and will buy up the bonds to keep rates low). At some point central banks may relent and at least allow the yield curve to steepen in order to accommodate inflation risk premiums for holding longer dated bonds. In this case, we believe we would see a reversal and a positive stock-bond correlation.
The historic data indicate that the stock-bond relationship is regime dependent. The critical threshold is sustained 2.5% inflation; below this, we expect the relationship to be negative; above this, there has been a positive stock-bond correlation.
These scenarios provide a range of market events that investors need to prepare for. These scenarios not only affect returns, but the potential relationship of stocks and bonds as well as the relative performance of asset classes.
Global implications for returns
Global implications for returns
With adjustments, these scenarios project to other major markets and produce similar results, though the level may vary depending on local valuation, interest rates and policy reactions.
One major adjustment is for valuation outside the US. Non-US equity markets have done worse than the US, but we expect a rebound, as not only the markets are cheaper, but their currencies are as well.
Normally, in scenario analysis, it is difficult to comment on the direction of currencies. Currency performance is about relative performance. For example, if one region is growing more strongly than the other, the currency will typically appreciate relative to the other, though underlying fundamentals will alter this drift and rate. We will address our expectations for currency in our five-year capital market assumptions in the following section.
The negative stock-bond correlation appears to be robust for the US, Japan, Europe, and the non-commodity emerging markets. Again, until we see a burst of sustained inflation, we don't expect the relationship to turn positive.
Scenario | Scenario | Stock-Bond Correlation | Stock-Bond Correlation | Implications | Implications |
|---|---|---|---|---|---|
Scenario | Bull | Stock-Bond Correlation | Stock-bond correlation remains negative as inflation does not go above 2.5% for an extended time period. | Implications | Diversified portfolios continue to provide low volatility and consistent returns. Risk-on/risk-off positioning has a natural hedge. |
Scenario | Base Case | Stock-Bond Correlation | Stock-bond correlation remains generally negative, but with yield curve controls, this may drift towards zero. | Implications | Bonds offer less diversification than has been the case of the last 20 years, increasing complexity for risk management. |
Scenario | Stagnation | Stock-Bond Correlation | Stock-bond correlation becomes less stable. At times this can be negative (with flight-to-quality events), but because of lower bounds, the relationship can drift to zero as well. | Implications | Diversified portfolios will be subject to more volatility as the stock- bond correlation is erratic. Investors take on more risk (higher exposure to credits over sovereigns, for example) to increase yield and expected return. |
Scenario | Stagflation | Stock-Bond Correlation | Initially, the stock-bond correlation remains negative, but as additional stimulus programs get rolled out and budget deficits rise, inflation rises as well. Short term rates are kept low for a while as central banks are conflicted on which front to fight: inflation or low growth. When inflation rises to 2.5% and is expected to stay there, we get an eventual change to a positive stock-bond correlation. | Implications | Risk management for traditional stock-bond portfolios becomes more difficult, requiring real or alternative assets to hedge against inflation.
Although nominal returns start to rise, in real terms the markets do poorly. Enhanced risk controlled techniques needed; disciplined volatility management. |
