Job market resilience could prolong the late-cycle
Investors may be surprised at the resilience of the global economy in 2023. Here, the Investment Solutions team discuss how the Fed’s desire to keep financial conditions tight means risk assets are not out of the woods.
So far this year, the US Federal Reserve has raised rates over six straight meetings by a total of 375 bps. Assuming the Fed follows through with an expected 50 basis points hike in December, it will have delivered the most cumulative tightening in any calendar year since 1980. The speed and magnitude of rate hikes is, by design, weighing on the US economy in order to bring inflation down.
Amid this backdrop, over 75% of fund managers think a recession is likely over the next 12 months – a level roughly on par with peak pessimism during the global financial crisis in 2009 and the COVID-19 pandemic in 20201.
While a recession is a very real possibility, investors may be surprised by the resilience of the global economy – even with such a sharp tightening in financial conditions. The labor market will certainly cool, but healthy household balance sheets should continue to support spending in the services sector (Tables 1&2). Moreover, some of the major drags on the world economy emanating from Europe and China are poised to get better, not worse, between now and the end of Q1 2023.
Avoiding a recession would clearly be good news; however, it would not signal an all-clear for risk assets. A more resilient economy may also mean central banks need to do more, not less, in order to get inflation durably back to target. And this raises the risks of a harder landing down the road. But, in our view, it is too early to pre-position for very negative economic outcomes. A longer-lasting late cycle environment can persist for some time, and investors will have to be flexible and discerning in 2023 given these potential dynamics.
Table 1: US Labor Market Metrics to Monitor
US Labor Market Metrics to Monitor | US Labor Market Metrics to Monitor | Most recent data* | Most recent data* | End-2019 | End-2019 | Difference | Difference |
|---|---|---|---|---|---|---|---|
US Labor Market Metrics to Monitor | Unemployment rate (U3) | Most recent data* | 3.7% (Oct) | End-2019 | 3.60% | Difference | +0.10% |
US Labor Market Metrics to Monitor | Private Employment Cost Index: Wages and Salaries | Most recent data* | 5.3% (Q3) | End-2019 | 3% | Difference | +2.30% |
US Labor Market Metrics to Monitor | Initial jobless claims | Most recent data* | 222K (Nov 12) | End-2019 | 235K | Difference | -13k |
US Labor Market Metrics to Monitor | Continuing jobless claims | Most recent data* | 1.5m (Nov 5) | End-2019 | 1.9m | Difference | -400k |
US Labor Market Metrics to Monitor | Prime-age employment to population ratio | Most recent data* | 79.8% (Oct) | End-2019 | 80.30% | Difference | -0.5% |
US Labor Market Metrics to Monitor | Aggregate labor income (YoY) | Most recent data* | 8.7% (Oct) | End-2019 | 3.70% | Difference | +5% |
US Labor Market Metrics to Monitor | Private sector quits rate | Most recent data* | 2.9% (Sept) | End-2019 | 2.60% | Difference | +0.3% |
Table 2: Developed market central banks’ key wage metrics
Central Bank | Central Bank | Key Wage Metric | Key Wage Metric | %YoY Chg (Latest Reading) | %YoY Chg (Latest Reading) |
|---|---|---|---|---|---|
Central Bank | Federal Reserve | Key Wage Metric | Private Employment Cost Index: Wages & Salaries (Q3) | %YoY Chg (Latest Reading) | +5.3% |
Central Bank | European Central Bank | Key Wage Metric | ECB Indicator of Negotiated Wages (Q2) | %YoY Chg (Latest Reading) | +2.4% |
Central Bank | Bank of Japan | Key Wage Metric | Scheduled Contractual Earnings (Sept) | %YoY Chg (Latest Reading) | +1.6% |
Central Bank | Bank of England | Key Wage Metric | Average Weekly Earnings Ex-Bonus/Arrears (Sept) | %YoY Chg (Latest Reading) | +6.3% |
Central Bank | Reserve Bank of Australia | Key Wage Metric | Wage Price Index Ex-Bonus (Q3) | %YoY Chg (Latest Reading) | +3.1% |
Central Bank | Reserve Bank of New Zealand | Key Wage Metric | Index of Salary & Wages (Q3) | %YoY Chg (Latest Reading) | +3.9% |
Central Bank | Bank of Canada | Key Wage Metric | BoC Common Wage Index (Q2) | %YoY Chg (Latest Reading) | +3.3% |
The Fed vs. the US labor market
The Fed vs. the US labor market
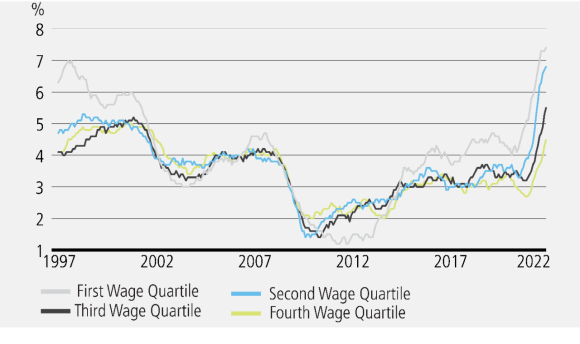
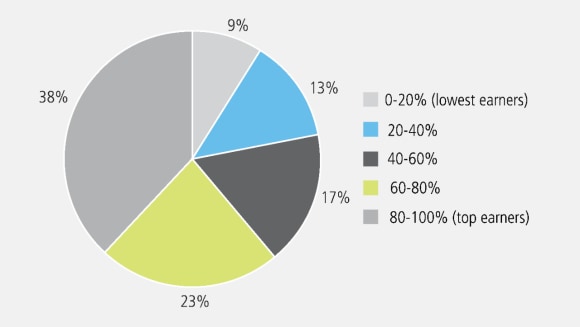
To best understand US economic dynamics, it is necessary to break down the US labor market into lower and higher income cohorts. Lower wage employees, who are disproportionately employed in the service sector, are experiencing very strong wage growth (Chart 1). This is happening in large part because higher income workers still have a lot of excess savings, which they are ready and more than willing to spend in the service sector2 . While high earners have a lower marginal propensity to consume (that is, they spend a smaller percentage of their income compared to lower earners), they also account for the lion’s share of total consumption (Chart 2).
Chart 1 - US income growth is strongest among the lowest earners

Chart 2 – Top 40% of earners account for 60% of spending

It is the Fed’s job to cool this situation down, and make sure it doesn’t turn into a wage-price spiral. The Fed’s tightening of financial conditions has meant some progress in slowing aggregate labor income, cooling the housing market and bringing down goods consumption. But the service spending dynamics mentioned above are unique to this COVID-19-driven cycle and arguably tougher to break. We believe this means the US economy (and earnings) probably don’t fall off as sharply as many are projecting, and, however, also the Fed will need to keep rates higher for longer.
In the meantime, China is signaling the relaxation of zero-COVID-19 measures, even in the face of elevated case counts. In our view, this suggests a commitment to such a shift in policy, which should allow for a boost in consumption. The process is unlikely to play out in a straight line, but the direction of travel seems pretty clear, to us. Our confidence that the bottom is in for China is fortified since these adjustments to COVID-19 policy are taking place in tandem with the most comprehensive support for the property sector to date. A rebounding China may provide a needed boost as developed economies slow, but will also likely lead to higher commodity prices. This too may make it difficult for the Fed and other central banks to back off too quickly.
Asset allocation
Asset allocation
Macro and cross-asset volatility are unlikely to fade away along with the calendar year. And the distribution of outcomes remains much wider than investors became accustomed to in the previous cycle. Our focus is therefore on positioning over the coming months as opposed to the coming year, and we are ready to pivot as the business cycle evolves.
Going into 2023, we expect global equities at an index level to remain range-bound. They will likely be capped to the upside by the Fed’s desire to keep financial conditions from easing too much. However, we expect some cushion on the downside from a resilient economy and rebounding China.
The relative value opportunity set across global equities appears fertile. Financials and energy are our preferred sectors. This is because we believe cyclically-oriented positions should perform if what appears to be overstated pessimism on global growth fades in the face of resilient economic data. Activity surprising to the upside and a higher-for-longer rate outlook should benefit value stocks relative to growth, in our view – particularly as profit estimates for inexpensive companies are holding up well relative to their pricier peers.
On a regional basis, Japan is buoyed by a rare combination of accommodative monetary and fiscal stimulus.
We are neutral on government bonds. The Fed is likely to be slow in ending or reversing its hiking cycle as long as the US labor market bends but does not break, while signs that overall inflation has peaked may reduce the odds of over-tightening. However, price pressures are likely to remain stubbornly high – a side effect of a US labor market that refuses to crack. China’s reopening should fuel a pick-up in domestic oil demand, offsetting some of the downward pressure on inflation from goods prices. In US and European credit, investment grade bond yields look increasingly attractive as a balance between a potentially resilient economy and more range-bound government bond yields.
We see commodities as attractive both on an outright basis and for the hedging role they serve in multi-asset portfolios. Already low inventories can continue to shrink in an environment of slowing growth so long as supply remains constrained – as is the case across most key commodity markets. Securing sufficient access to energy is not a problem that will be solved at the end of this winter – and may grow more intense as Chinese demand increases if mobility restrictions are removed. In addition, commodities have a track record of strong performance during months when stocks and bonds suffer meaningful declines.
In currencies, we believe we have moved from a strong, trending US dollar to more of a rangebound trade in USD. Our catalysts for a broad turn in the dollar are for the Fed to stop hiking interest rates, China’s zero-COVID-19 policy to end, and energy pressures in Europe stemming from Russia’s invasion of Ukraine to subside. None of these have fully happened yet, but all three appear to be getting closer. A more rangebound dollar coupled with a global economy that is still growing, but slowing, could provide a very positive backdrop for high carry, commodity-linked currencies. We prefer the Brazilian real and Mexican peso.
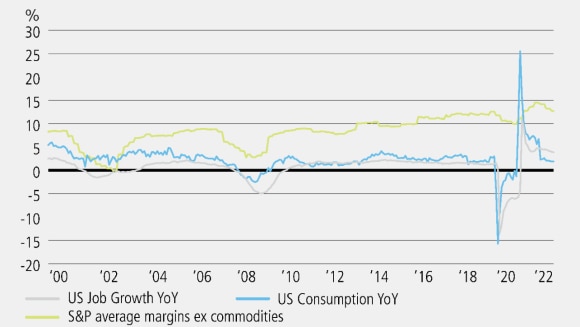
Chart 3: S&P 500 margins tend to be positively correlated with jobs, spending growth

About the authors

Evan Brown
Head of Multi-Asset Strategy, UBS Asset Management
Evan Brown, CFA is Head of Multi-Asset Strategy in the Investment Solutions team at UBS Asset Management. In this role, Evan drives macro research and tactical asset allocation investment process for over USD100 billion in client portfolios. Additionally, he is responsible for advising UBS Asset Management’s global institutional and private wealth client base on the macroeconomic outlook and asset allocation.

Ryan Primmer
Head of Investment Solutions
Ryan oversees UBS Investment Solutions, including Asset Allocation, Portfolio Management, Implementation, Analytics, and Modelling teams. Ryan rejoined UBS in June 2018 from KCG Holdings, holding roles like Head of Quantitative and Systematic Trading, and Head of Global Quantitative Strategies. At UBS (1991-2013), he held leadership roles including Global Head of Equities Trading, Global Head of Equities Proprietary Trading, and Head of SNB StabFund Investment Management managing distressed mortgage assets.

PDF
Investment outlook 2023
Investment outlook 2023
In this edition of Panorama, our investment experts recap on the past investment year and explore where the challenges, opportunities and surprises might spring from.
Was this article helpful?
Please enable javascript in your browser and retry.
The feedback component cannot be displayed.
Read more
Make an inquiry
Fill in an inquiry form and leave your details – we’ll be back in touch.
Introducing our leadership team
Meet the members of the team responsible for UBS Asset Management’s strategic direction.


