Staying the course
Staying the course
The economy
APAC GDP expectedly slowed in recent quarters amidst a tight monetary backdrop. Nonetheless, the slowdown was gradual and most economies stayed largely resilient. Exports generally improved this year driven by a tech upcycle. Oxford Economics has upgraded its forecasts several times this year. It now expects APAC GDP to grow 3.9% in both 2024 and 2025, compared to 4.4% in 2023. 3Q24 numbers, so far, are still painting broadly the same story: falling inflation, a healthy job market, improving external trade and resilient consumption.
Overall, the macro seems to be chugging along. However, there could be downside risks on the horizon. The political landscape has shifted rather meaningfully and could risk throwing a spanner in the works . A Trump presidency is now the reality, which could have ramifications on geopolitics and trades. The immediate risk is a 60% US tariff threat on China. If this comes to pass, UBS Investment Bank (UBS IB) estimates it could lead to a 250bps drag on China’s GDP growth with half the impact coming from a decline in net exports and the rest from an indirect impact on consumption and investment. Some mitigation is expected from potential policy support which could limit the negative drag to 150bps. It remains to be seen how China will react. Encouragingly, there has been some positive changes in the government’s attitude since September after a long period of lackluster policy responses.
The impact on other APAC countries is less clear at this point. A weak China typically spells bad news for the
trade-reliant region. However, trade re-routing, supply chain re-alignment and a stronger US growth could play offset. Vietnam, India and ASEAN, for example, could be relative beneficiaries from the adjustments in supply chain.
We think higher US bond yields and a stronger USD have negative implications for APAC. The former keeps costs of capital elevated while the latter may restrict the ability of APAC central banks to cut rates. For now, the consensus still broadly expects the same trajectory for interest rates. UBS IB forecasts US Fed to cut another 25bps in December and 125bps in 2025.
In APAC, South Korea started to cut rates in October 2024 and could deliver another 125bps cuts in 2025. Australia is holding still and expected to only start reducing rates in May 2025. Japan’s situation is more complex. The loss of a majority government casted doubt on whether the Bank of Japan (BoJ) would continue its policy normalization. Now, a stronger USD outlook post the US election may force its hand to carry on. UBS IB continues to expect a 25bps hike in December 2024 and two more in 2025. USD/JPY are now expected to stay at the current 155-160 levels for the next two years.
Leasing and capital markets
APAC leasing activity was mixed in 3Q24. According to CBRE, office net absorption was flat QoQ but was still up YoY on a 9M basis driven by demand from tech and finance sectors. Logistics space take-up continued to normalize from pandemic-highs as occupiers became
cost-conscious. Coupled with elevated supply, vacancy rates rose and rents fell driven by China and Hong Kong. Australia remained the bright spot. The retail sector stayed resilient with stable rents and lower vacancies despite moderating sales performance.
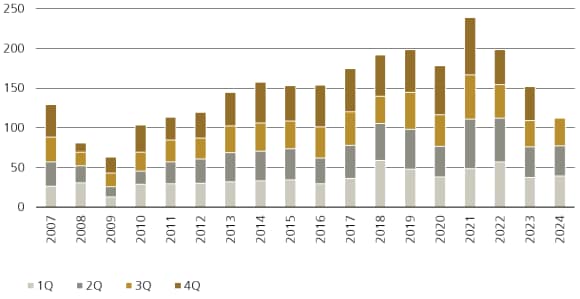
In the capital markets, transaction activity is still weak in 3Q24 but starting to show signs of recovery in markets that have seen significant repricing. According to MSCI (see Figure 1), APAC volumes for the quarter improved 6% YoY off a low base. Australia (+20%) and South Korea (+24%) rebounded after significant repricing. Singapore jumped 520%, boosted by a huge industrial portfolio transaction by Warburg Pincus and Lend-lease. China also improved 15% with distressed deals making up nearly a quarter of volume. Offsetting this was Japan (-46%), though MSCI data here typically gets revised up. By sector, the recovery was broad-based except for the hotel sector (-26%).
Cap rates are starting to stabilize in most countries. In Australia, Melbourne continued to expand in 3Q24, while Sydney was stable for office and compressed 10bps for industrial. China was an outlier where cap rate expansion seems to be gaining pace across all sectors. Broadly, we think the cap rate upcycle is nearing the end. Elevated interest rates could trigger further increases but likely marginal. This is evidenced by the revival of investment interest in key markets.
Figure 1: APAC transaction volume (USD billion)

Does the recovery have legs?
Does the recovery have legs?
APAC real estate market returns are showing signs of bottoming out. Based on MSCI data, Japan’s total returns have improved for two consecutive quarters in the first two quarters of 2024, while Australia also delivered its first positive returns in 18 months. In the listed market, while Australia is the only country that recorded positive performance year-to-date, other REIT markets are also mostly up from their recent lows. Is the worst finally over
In our base case, yes. However, the answer comes together with several ifs and buts. Importantly, interest rates will have to continue falling according to current market expectations. Also, inflation will have to stay well behaved. Further escalation in geopolitical tensions is a tail risk but the current assumption is for it to remain contained. Barring unforeseen events, the current macro setting, as covered on the previous page, should be supportive of a continued recovery in real estate.
We think the current yield expansion cycle is nearing an end. Overall, we expect there may be a bit more to go at varying degree by market. Comparing the current yield spread to the long-term averages should provide a good indication, though the changes in fundamentals should also be taken into consideration. For example, the industrial sector in general should justify a tighter yield spread than in the past, as its stronger growth profile supercharged bye-commerce is a relatively recent phenomenon. Similarly, Japan’s emergence from its deflation past also renders any historical comparison less meaningful.
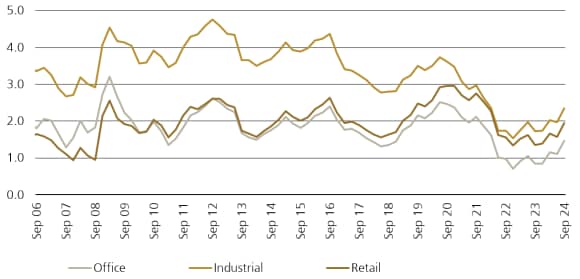
Broadly, we estimate that the 3Q24 real estate yield spread is still at about 25-50bps below ‘fair’ levels. In other words, current real estate valuations are already factoring in interest rate cuts to some extent. If this fails to or takes longer to play out, we think there would be risks of further cap rate expansion. By sector, retail yield spread is almost on par with the 10Y pre-pandemic average, implying a relatively ‘fair’ cap rate. Office yield spread is still 40bps below historical average, implying potentially more expansion if bond yields stay elevated. Industrial yield spread is furthest away at 140bps below its historical average. Some further expansion is possible, but we do not expect the gap to be fully closed given its stronger fundamentals and investor interests (see Figure 2).
By country, Hong Kong has the tightest yield spread and likely most vulnerable to further correction. This is followed by Singapore, though its strong macro and long-term capitals are likely to provide support. Australia is close to average but not quite there yet (25-50bps below). At the other end of the spectrum, China has the highest yield spread and above historical average. The same analysis would imply upside potential, but we think China is an anomaly. Investors are likely baking in higher risk premium given its weak fundamentals and geopolitical risks.
Revival in Australia and South Korea
Australia and South Korea have witnessed consecutive quarters of volume recovery this year. In 9M24, transaction volume jumped 14% and 25%, respectively, outperforming the APAC average of +3%. This indicates that yield spreads for both markets are now at more palatable levels for investors to bite.
In Australia, cap rates expanded the most among other APAC markets with logistics and office up close to 150-200bps since mid-2022. Logistics capital value held firm thanks to a positive offset from phenomenal rental growth. Meanwhile, office capital values fell 20-30% for prime assets in Sydney and Melbourne. The decline was similar to the GFC period despite limited distressed deals. It is no wonder many overseas investors are taking the plunge. For example, three companies from Singapore have each picked up a prime building in Sydney this year.
In South Korea, 9M24 volume has already recovered to 5% above 2019 levels. Logistics made a comeback and rebounded 52% YoY following cap rate expansion of 70bps since early-2023 (120bps since mid-2022). While the repricing has not been as great as in Australia, South Korea’s yield spread has improved significantly due to meaningful improvements in the financing environment. For example, 5-year interest rate swap has fallen 90bps from the 4Q22 peak to about 2.9% in 3Q24 on the back of falling inflation expectations. Meanwhile, office cap rates have not expanded much (+30bps) but continues to garner strong investor interests due to its robust rental outlook.
Figure 2: APAC yield spread (ppt)


The Red Thread – Private Markets
Our semi-annual insights into private markets
Our semi-annual insights into private markets


