Looking through the short-term noise in China
Opportunities continue to exist for active managers, though not without some risks
At first glance China appears to have become a risky market to invest in: ageing demographics, tighter regulations, geopolitical tensions, ambiguous COVID policies, a troubled real estate sector, and a more socialist bent in policies. While cognizant of these risks, we believe the long-term active investment opportunities do still appear to outweigh the risks.
Despite an eventful couple of years, China remains a fertile ground for active management with significant opportunities for alpha capture. As illustrated in the charts below, the China onshore market (as represented by MSCI China A Onshore (r) Index ) has only returned 3.8% per annum from March 2007 to November 2022, underperforming broad global markets (as represented by MSCI World Index). Our actively managed China A Equity strategy, however , has returned +8.4% p .a. over this period, outperforming MSCI World. Performance numbers are net of fees.
The question is not whether China is still investable; it is knowing where the alpha opportunities may lie.
China onshore: A larger opportunity for active investors
China onshore: A larger opportunity for active investors
Actively managed China A Equity (net of fees) has performed much better than not only the MSCI China A index, but also the MSCI World
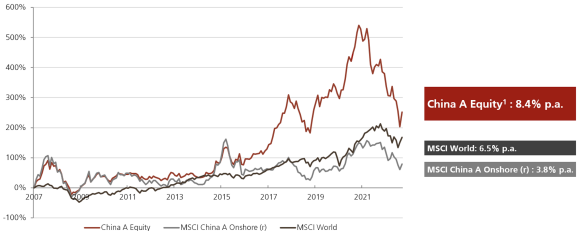
Performance: China A Equity strategy*
Calendar year performance since launch, as of end November 2022
In USD (%) | In USD (%) | 3M | 3M | YTD | YTD | 1 Year | 1 Year | 3 Years (p.a.) | 3 Years (p.a.) | 5 Years (p.a.) | 5 Years (p.a.) | 10 Years (p.a.) | 10 Years (p.a.) | Since Inception (p.a.) | Since Inception (p.a.) |
|---|---|---|---|---|---|---|---|---|---|---|---|---|---|---|---|
In USD (%) | China A Equity strategy (net of fees) | 3M | -9.5 | YTD | -33.4 | 1 Year | -30.4 | 3 Years (p.a.) | -5.8 | 5 Years (p.a.) | 0.2 | 10 Years (p.a.) | 10.7 | Since Inception (p.a.) | 8.4 |
In USD (%) | Benchmark: MSCI China A Onshore (r) | 3M | -7.9 | YTD | -28.5 | 1 Year | -28.0 | 3 Years (p.a.) | 4.0 | 5 Years (p.a.) | -0.6 | 10 Years (p.a.) | 5.6 | Since Inception (p.a.) | 3.8 |
In USD (%) | Value added versus benchmark | 3M | -1.6 | YTD | -4.9 | 1 Year | -2.4 | 3 Years (p.a.) | -9.8 | 5 Years (p.a.) | 0.8 | 10 Years (p.a.) | 5.1 | Since Inception (p.a.) | 4.6 |
Science and technology key to the future
Science and technology key to the future
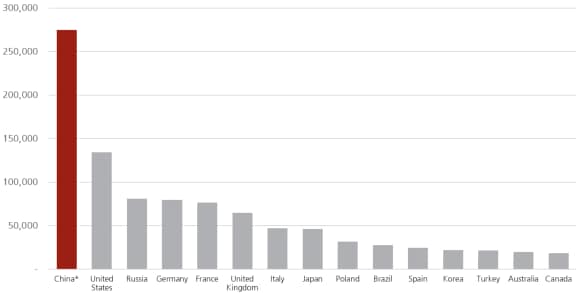
Our conviction arises from looking at China’s economic agenda and long-term objectives, many of which are tied to technology and innovation. China churns out, by far, the largest number of STEM (Science, Technology, Engineering, Mathematics) graduates and post-graduates of any country in the world—an important indicator of potential future competitiveness in technology. According to 2019 data from OECD and PRC MOE (as shown below), China was already producing double the number of STEM post-graduates of the next country (United States).
China has highest number of STEM post-graduates
STEM postgraduates in 2019 (Total)
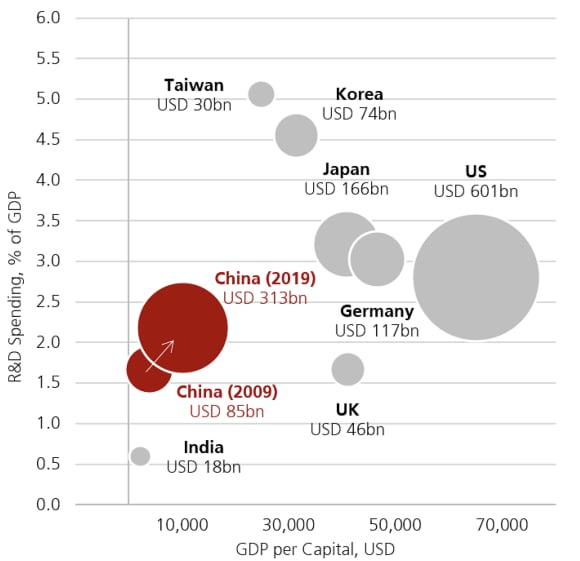
China’s technological prowess is also proven by the largest number of international patent applications, in which China took the lead from the US recently, according to The Global Economy using data from 1985 to 2020. The country’s steady rise in the global ranking for R&D spending—second only to the US—is a major contributor (see chart below). China’s growth will likely continue to be spurred by R&D and innovation in many sectors, including technology hardware and healthcare, and their STEM talent pool should enable this effort.
Strong growth in China’s R&D spending
Largest IPO market in the world
Largest IPO market in the world
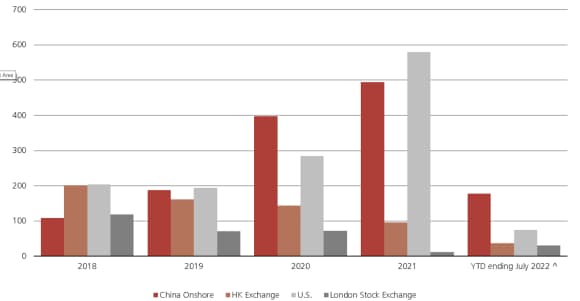
All of the above is leading to a world-topping number of initial public offerings (IPOs), which implies more companies coming to market and increases the opportunity set for active management. The number of IPOs in the China onshore and Hong Kong markets combined have outnumbered the number of US IPOs for the past five years (see chart below).
Investors agree that 2022 has been a challenging year for China markets, but as of 17 November 2022 Chinese companies have raised US$71.2 billion through IPOs in domestic and overseas markets this year. This compares to US corporate issuance of US$17.3 billion and Europe's US$16.4 billion over the same period (source: Refinitiv).
China is now the most active IPO market
No. of IPOs (from 2018 to end July 2022)
China’s onshore market remains formidable and is expected to see continued capital flows and investor interest. As the Chinese government continues to stress that real estate is for living in and not speculation or investing, we expect more domestic flows to be directed towards financial assets. Along those lines, the central government released a framework in April 2022 to develop the private pension market, as the state-run pension system faces growing pressure from an ageing population.
A good diversifier
A good diversifier
For investors looking to better understand the role Chinese assets can play in their wider portfolios, China equities provide diversification benefits as the China markets, especially the onshore market, have low correlation to major regional and global indices, as shown below across more than 20 years of data.
China A benefits from low correlation across global indices
Correlation (TR USD) January 2002 to September 2022
At first glance China appears to have become a risky market to invest in: ageing demographics, tighter regulations, geopolitical tensions, ambiguous COVID policies, a troubled real estate sector, and a more socialist bent in policies. While cognizant of these risks, we believe the long-term active investment opportunities do still appear to outweigh the risks.
Despite an eventful couple of years, China remains a fertile ground for active management with significant opportunities for alpha capture. As illustrated in the charts below, the China onshore market (as represented by MSCI China A Onshore (r) Index) has only returned 3.8% per annum from March 2007 to November 2022, underperforming broad global markets (as represented by MSCI World Index). Our actively managed China A Equity strategy, however, has returned +8.4% p.a. over this period, outperforming MSCI World. Performance numbers are net of fees.
The question is not whether China is still investable; it is knowing where the alpha opportunities may lie.
MSCI | MSCI | MSCI North America | MSCI North America | MSCI Europe | MSCI Europe | MSCI Pacific | MSCI Pacific | MSCI China ex A-Shares | MSCI China ex A-Shares | MSCI China A-Shares | MSCI China A-Shares | MSCI EM Asia ex China | MSCI EM Asia ex China | MSCI EM EMEA | MSCI EM EMEA | MSCI EM LATAM | MSCI EM LATAM |
|---|---|---|---|---|---|---|---|---|---|---|---|---|---|---|---|---|---|
MSCI | MSCI North America | MSCI North America | 1.00 | MSCI Europe | 0.88 | MSCI Pacific | 0.77 | MSCI China ex A-Shares | 0.56 | MSCI China A-Shares | 0.34 | MSCI EM Asia ex China | 0.77 | MSCI EM EMEA | 0.73 | MSCI EM LATAM | 0.69 |
MSCI | MSCI Europe | MSCI North America | 0.88 | MSCI Europe | 1.00 | MSCI Pacific | 0.81 | MSCI China ex A-Shares | 0.63 | MSCI China A-Shares | 0.36 | MSCI EM Asia ex China | 0.80 | MSCI EM EMEA | 0.82 | MSCI EM LATAM | 0.74 |
MSCI | MSCI Pacific | MSCI North America | 0.77 | MSCI Europe | 0.81 | MSCI Pacific | 1.00 | MSCI China ex A-Shares | 0.65 | MSCI China A-Shares | 0.35 | MSCI EM Asia ex China | 0.79 | MSCI EM EMEA | 0.79 | MSCI EM LATAM | 0.69 |
MSCI | MSCI China ex A-Shares | MSCI North America | 0.56 | MSCI Europe | 0.63 | MSCI Pacific | 0.65 | MSCI China ex A-Shares | 1.00 | MSCI China A-Shares | 0.61 | MSCI EM Asia ex China | 0.72 | MSCI EM EMEA | 0.67 | MSCI EM LATAM | 0.60 |
MSCI | MSCI China A-Shares | MSCI North America | 0.34 | MSCI Europe | 0.36 | MSCI Pacific | 0.35 | MSCI China ex A-Shares | 0.61 | MSCI China A-Shares | 1.00 | MSCI EM Asia ex China | 0.41 | MSCI EM EMEA | 0.33 | MSCI EM LATAM | 0.34 |
MSCI | MSCI EM Asia ex China | MSCI North America | 0.77 | MSCI Europe | 0.80 | MSCI Pacific | 0.79 | MSCI China ex A-Shares | 0.72 | MSCI China A-Shares | 0.41 | MSCI EM Asia ex China | 1.00 | MSCI EM EMEA | 0.81 | MSCI EM LATAM | 0.76 |
MSCI | MSCI EM EMEA | MSCI North America | 0.73 | MSCI Europe | 0.82 | MSCI Pacific | 0.79 | MSCI China ex A-Shares | 0.67 | MSCI China A-Shares | 0.33 | MSCI EM Asia ex China | 0.81 | MSCI EM EMEA | 1.00 | MSCI EM LATAM | 0.82 |
MSCI | MSCI EM LATAM | MSCI North America | 0.69 | MSCI Europe | 0.74 | MSCI Pacific | 0.69 | MSCI China ex A-Shares | 0.60 | MSCI China A-Shares | 0.34 | MSCI EM Asia ex China | 0.76 | MSCI EM EMEA | 0.82 | MSCI EM LATAM | 1.00 |
The risks
The risks
There are, however, risks to the long-term story. Investors have been worried about a perceived shift in the new leadership’s focus towards objectives that might imply more redistributive policies, curtailing free private enterprise, and stymieing economic growth.
It is too early to draw definitive conclusions and, now that the leadership team for President Xi’s third term is confirmed, we will monitor the government’s focus on economic growth, as well as its stance towards the private sector and entrepreneurs. We expect to see more clarity in the policies the government will implement in the next few years.
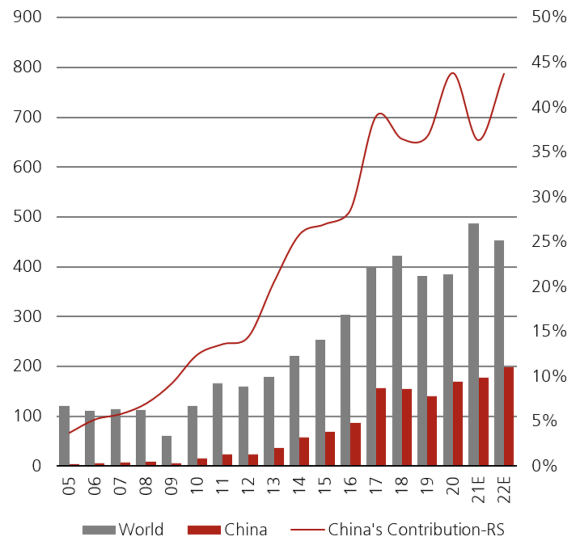
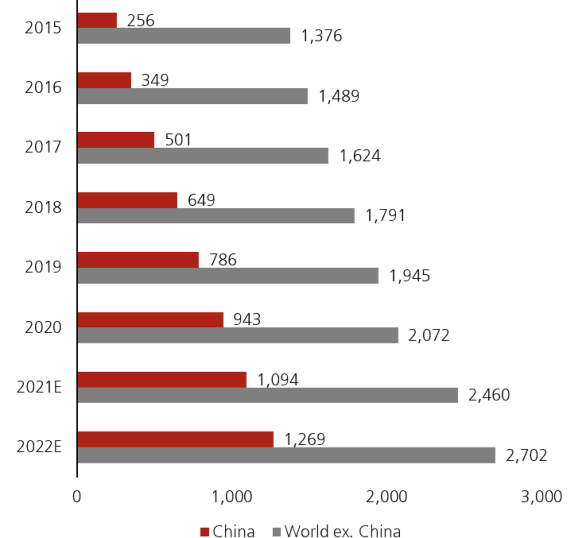
Another worry is that China is ageing faster than OECD countries, which could lead to China growing old before it grows rich. Together with its declining birth rate, China may fall into the middle income trap; a phenomenon characterized by lower economic and productivity growth. The Chinese government is trying to mitigate this by gradually raising the retirement age as well as by focusing on technological development like automation. As it is, China is responsible for almost half of annual global robotics sales and is home to around half the world’s installed robots (see charts).
Yearly sales of industrial robot (units in '000)
Total installed robots (units in '000)
Investors should not ignore China
Investors should not ignore China
China is the world's second largest economy, one of the largest trading financial markets, and is still a relatively fast-growing country. It has significant production and logistics advantages over developing countries. All of this suggest China will continue to dominate the international economic arena and investors should not ignore it.
The diversification benefits should not be overlooked either. Chinese equities, especially the onshore market, have a low correlation coefficient with other major equity markets and provide decent risk balancing effects for a global portfolio. This advantage, however, does come with higher volatility, as China is still a developing market.
Yet when considered holistically and over the long term, the benefits appear to outweigh the risks for active managers.
Make an inquiry
Fill in an inquiry form and leave your details – we’ll be back in touch.
Introducing our leadership team
Meet the members of the team responsible for UBS Asset Management’s strategic direction.
