Autos, Technology
Plugged In: Insights on Electric Vehicles in US
Read our key takeaways on the eighth wave of the UBS Evidence Lab electric vehicle consumer survey.

![]()
header.search.error
Autos, Technology
Read our key takeaways on the eighth wave of the UBS Evidence Lab electric vehicle consumer survey.
Key takeaways for US Market
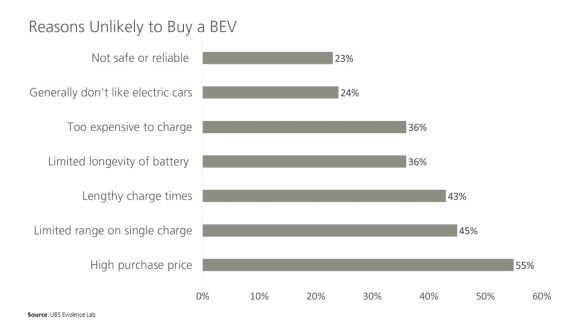
Of those who are not willing to buy a BEV, 〜55% state purchase price as the main gating factor…

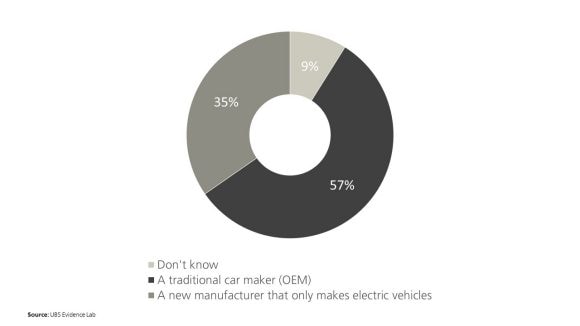
We note that US consumers would still want to buy a BEV from a legacy OEM (57%) instead of a new manufacturer that only makes electric vehicles (35%). We additionally analyzed BEV ownership satisfaction and found that price and battery longevity satisfaction increased, but range satisfaction decreased.
Most Likely to Buy a BEV from…

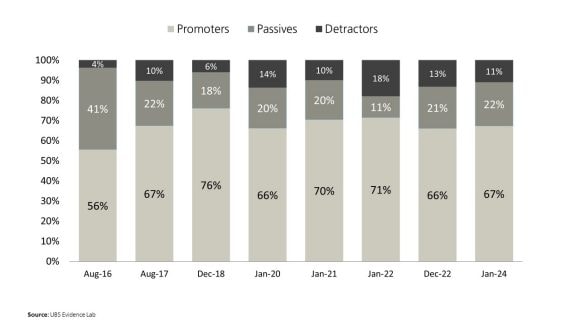
Across US BEV owners, we measured their likelihood to recommend a BEV to a friend on a scale of 1-10, with 10 being the highest likelihood. Respondents were grouped into the following categories: ‘Promoters’ (those who chose 9 or 10), ‘Passives’ (those who chose 7 or 8) and ‘Detractors’ (those who chose 6 or below).
How likely would you be to recommend an All-Electric Vehicle to a friend, relative or colleague?

Other findings include how lump sum payments are preferred at 55% compared to a subscription fee at 36%, which could be a potential headwind for companies that want to move towards a subscription service revenue model. When looking at EV charging infrastructure, ‘at home’ was cited as the most sufficient area, followed by cities/urban areas, at place of work/study and finally suburban/rural areas as the least sufficient in regard to EV charging infrastructure. However, from 2020-2024, we note an increase in consumers views on EV charging infrastructure being improved across all four areas.